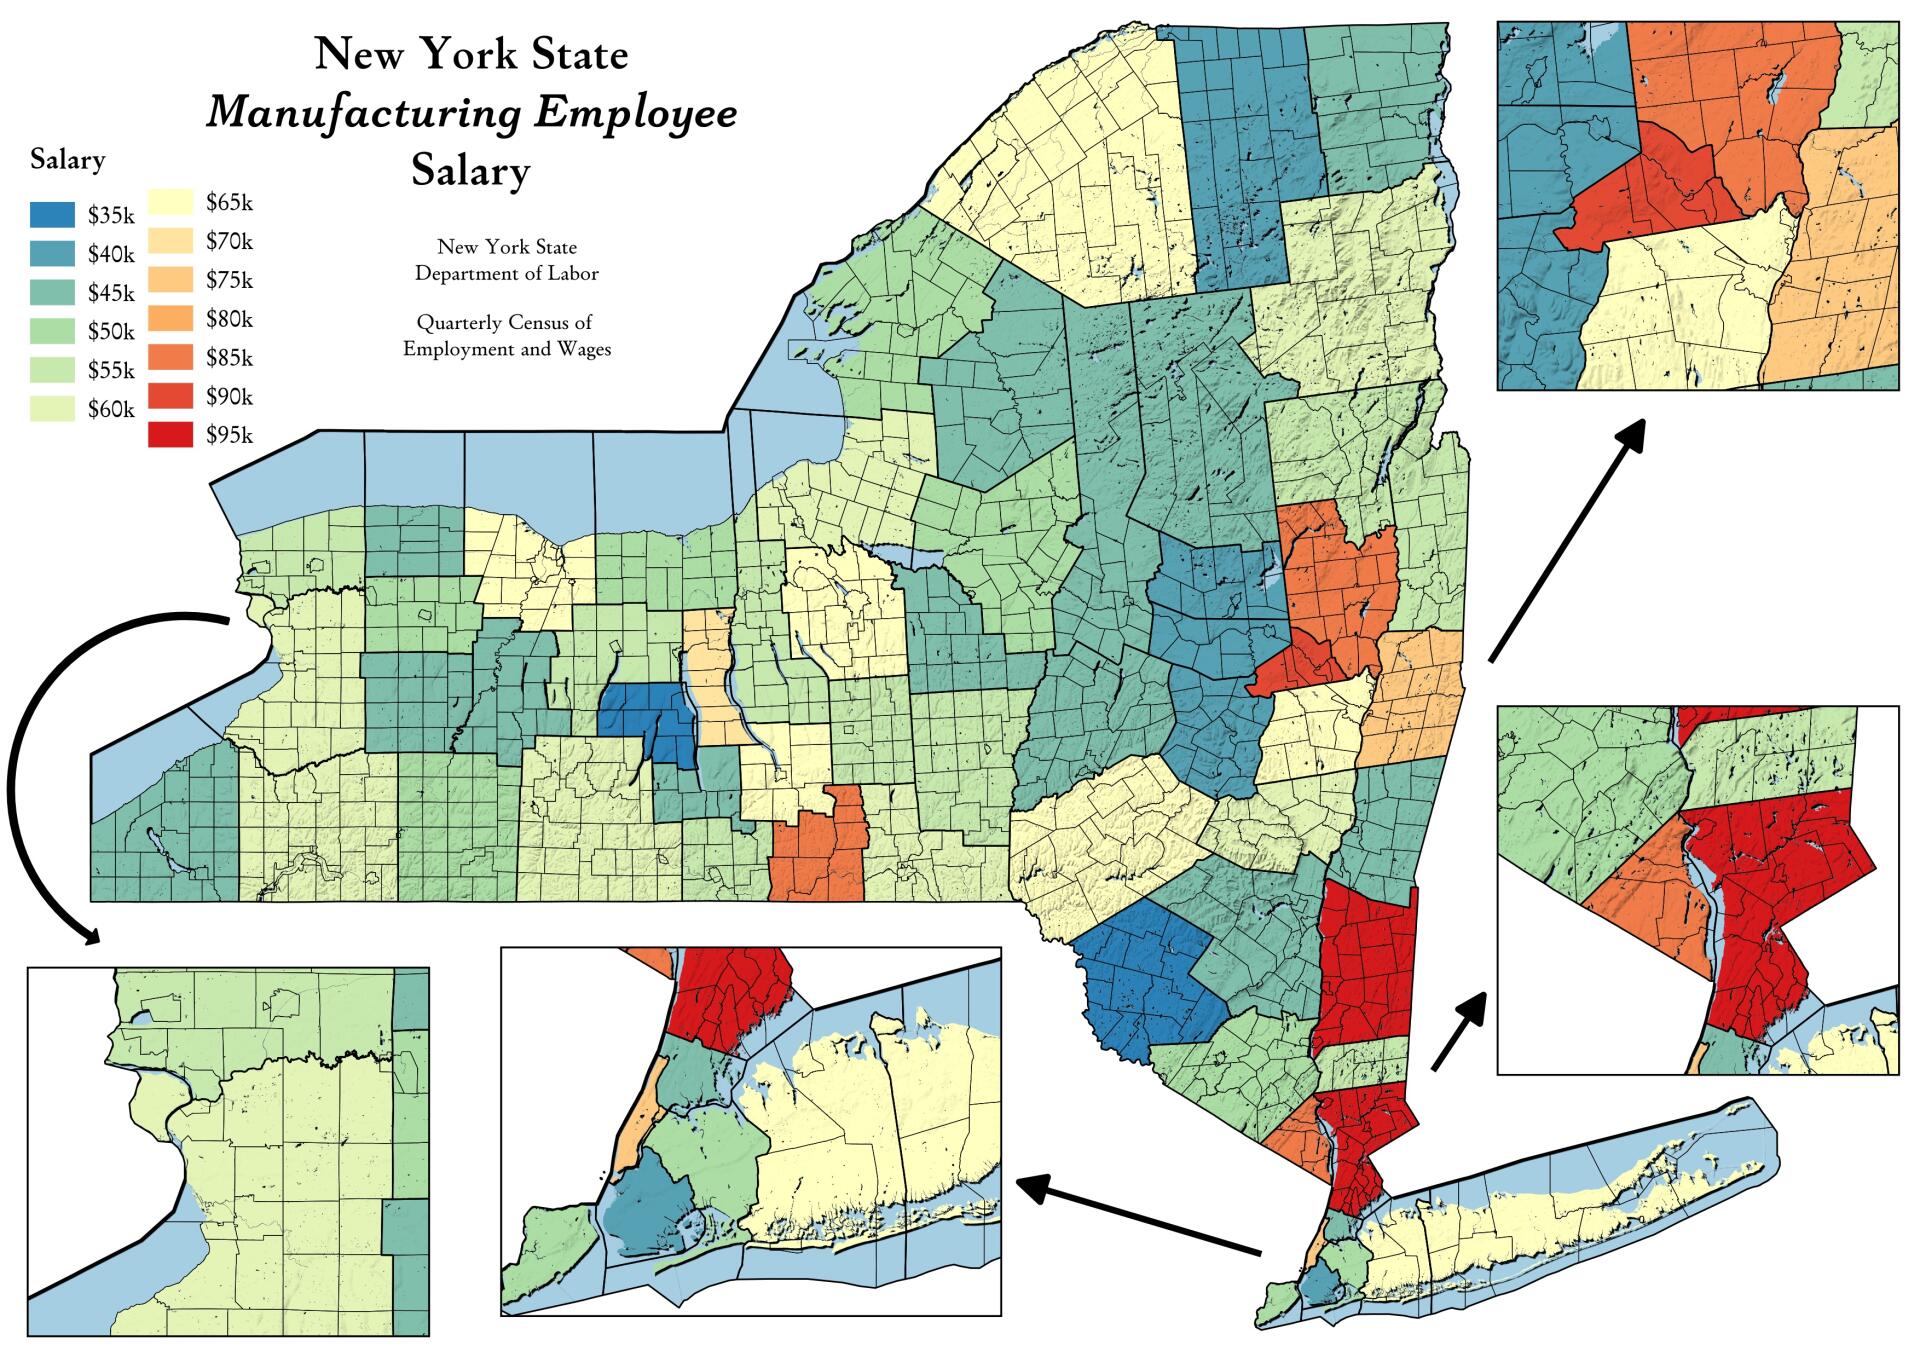
New York State Manufacturing Employee Salary

Download a High Resolution JPEG Image of the New York State Manufacturing Employee Salary or an Adobe Acrobat Printable PDF of the New York State Manufacturing Employee Salary.
About Map: New York State Manufacturing Employee Salary ....
While manufacturing jobs generally pay better then the median income in most regions of state, some locations, especially those with high-tech manufacturing, have jobs that pay much better then other counties.
Data Source: NYS Department of Labor. Quarterly Census of Employment and Wages Annual Data: Beginning 2000. https://data.ny.gov/Economic-Development/Quarterly-Census-of-Employment-and-Wages-Annual-Da/shc7-xcbw

Bookmark my free Interactive GPS Map for your phone:
https://andyarthur.org/ny
... shows your location as a blue dot in relationship to campsites, trails, state land. This online map requires cell service, won't work in remote country, so also bring a paper map.
Free Download of New & Historical USGS 1:24k Topograpic Maps
Interactive maps with backcountry and roadside camping: New York, Pennsylvania, West Virginia & Vermont. List of NYS DEC Lean-Tos and Firetowers.
Google Spreadsheet with Roadside, Primitive and Pay Campsites
More about Work...
Download the PDF Map Pack with All Maps from Work.


